Column Design Verification by (N-M) Interaction Diagram
Summary
Verifying Reinforced Concrete Column Design Using N-M Interaction Diagrams
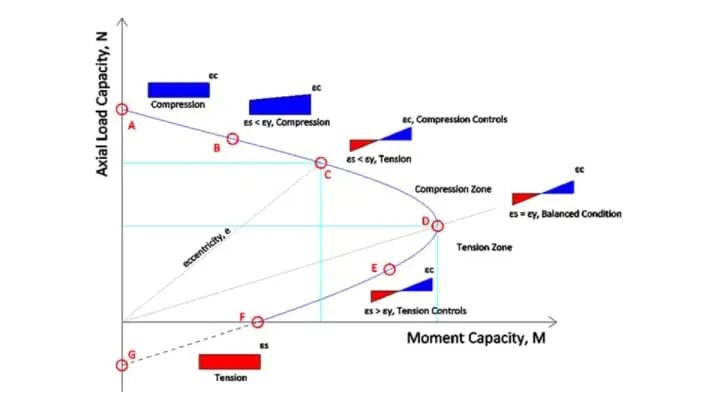
N-M Interaction Diagram column design is a vital process in structural engineering, enabling precise evaluation of the capacity of reinforced concrete columns. This process utilizes the N-M Interaction Diagram, also known as the Axial-Moment Capacity Curve, which illustrates the relationship between axial force (N) and bending moment (M). The diagram helps engineers ensure structural safety, serviceability, and compliance with building codes.
Steps to Verify Column Design with N-M Interaction Diagrams
Derive the Capacity Curve
Begin by using empirical formulas based on the concrete stress block to manually calculate the N-M Interaction Diagram. This includes determining the axial and bending capacities of the column section under varying loading scenarios. Engineers analyze these results to establish the performance limits of the column.Compare with Software Output
Generate the same N-M Interaction Diagram using ProtaStructure’s column design tools. The software automates this calculation, providing accurate and detailed capacity curves efficiently.Validate Results
Cross-check the manually derived interaction diagram with the curve generated by ProtaStructure. This comparison ensures that the software’s output is accurate and reliable, meeting engineering principles and design standards.
By following this three-step process, engineers can confidently validate column designs, ensuring optimal safety and performance.
Factors Influencing Column Capacity
Several factors impact the N-M Interaction Diagram and the column’s structural capacity:
- Material Properties: The strength and behavior of concrete and reinforcement play a significant role.
- Cross-Section Geometry: Column dimensions and reinforcement placement affect capacity.
- Load Combinations: The type, magnitude, and orientation of axial loads and bending moments influence the interaction curve.
- Boundary Conditions: The column’s support and connection details significantly impact its behavior under combined loads.
Applications in Real-World Projects
ProtaStructure has been widely used by engineers across the globe to design and verify reinforced concrete columns for a variety of structures. The software simplifies complex calculations while ensuring precision and compliance with international standards.
- Explore Real Projects: Browse our Projects Gallery to see how ProtaStructure has been used to design real-world structures, from high-rise buildings to industrial facilities.
- Customer Success Stories: Read inspiring customer success stories showcasing how ProtaStructure has helped engineers deliver safe and efficient designs for challenging projects.
Conclusion
Verifying reinforced concrete column design with N-M Interaction Diagrams is a critical step in ensuring structural integrity and compliance with codes. By deriving manual capacity curves and comparing them with ProtaStructure’s automated results, engineers can validate their designs confidently and efficiently. With its user-friendly tools and real-world applications, ProtaStructure remains an invaluable solution for modern structural engineers.


