

ProtaStructure Design Guide
Interpreting Contour Results at Slab–Wall Junctions
Why finite-element contour values and slab strip results differ at wall supports
|
Version 1.0 |
28 August 2026 |
Please contact us for your training and technical support queries
globalsupport@protasoftware.com
|
Limitation of Responsibilities |
Prota shall not be held responsible for any losses caused by documentation, software or usage errors. In addition to Prota License Agreement Terms, it is the responsibility of the user
|
|
|
Intellectual Property |
ProtaStructure is registered trademark of Prota Software Inc. and all intellectual property rights belongs to Prota Software Inc. Documentation, training and reference manuals and any program component can not be copied, distributed and used in violation of license agreement. |
|
|
Trademarks |
ProtaStructure®, ProtaDetails®, ProtaSteel® ve ProtaBIM® are registered trademarks of Prota Software Inc. Prota® logo is a trademark of Prota Software Inc. |
Table of Contents
How contour values are produced
What happens at a slab–wall junction
Why a symmetric model can show an asymmetric contour
Strip results: the values intended for design
Summary
Applies to FE Floor and FE Foundation analysis with walls modelled as shell elements.
When a floor slab or a raft is supported by shear walls or basement walls modelled with shell elements, two observations are frequently reported from the Analysis Results view:
- The support moments read from the M1 or M2 contour plot are noticeably smaller in magnitude than the support moments reported by a slab strip or section cut through the same location.
- The contour plot may not be symmetric at two opposite, identically supported edges, even though the geometry, mesh and loading are perfectly symmetric.
Both observations have the same cause. Contour plots are drawn from nodal values that are averaged over every shell element connected to each node — including the wall shells that meet the slab along its supported edges. Slab strips and section cuts are computed from the local results of the slab shells only; wall shells are deliberately excluded. Away from the walls the two approaches use the same information and produce the same values. Exactly at the slab–wall junctions they answer two different questions, and therefore show different numbers.
Neither number is wrong. The contour is a smoothed visualisation of the finite-element solution; the strip result is the bending moment in the slab itself. For reinforcement design at supported edges, use the strip and design results — that is what they are for.
What you may observe
Consider a square slab supported on all four edges by basement walls modelled as shells, analysed for the combination D + 1.6L, with plate bending moments displayed in kg·m/m. Figure 1 shows the M1 contour in plan. At the supports, the two edges perpendicular to direction 1 do not match: the band at one edge reaches about −852, while the opposite edge only reaches about −628 — an asymmetric picture for a fully symmetric model.
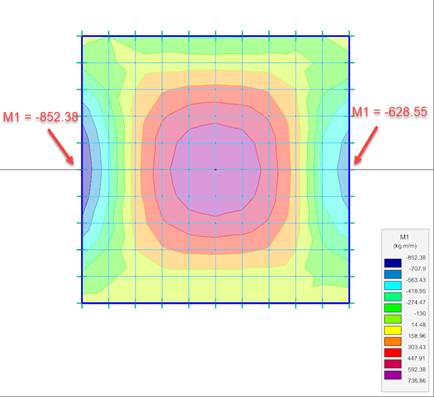
Figure 1 — M1 contour of a symmetric slab supported by shell walls. The support bands at the two opposite edges differ.
Figure 2 shows a section cut through the centre of the same slab. The moment diagram along the cut reports −1480.93 kg·m/m at both supports — perfectly symmetric, and roughly twice the magnitude suggested by the contour colours at the edges. Along the span, the diagram is consistent with the contour.
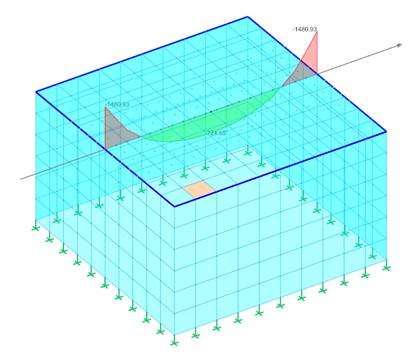
Figure 2 — The same model, cut along the centre line: the strip reports −1480.93 kg·m/m at both supports, symmetrically.
How contour values are produced
Every value shown on a shell contour goes through the following chain:
- The solver computes results at the integration points inside each shell element.
- These are extrapolated to the element corners (joints). Each element therefore carries its own set of joint values.
- Where several elements share a node, each element reports a slightly different value there. For display, the values of all shell elements connected to the node are averaged into a single number per node and per loading, and stored in the nodal results database.
- The contour is drawn by interpolating these averaged nodal values across the element faces.
Nodal averaging is standard practice in finite-element post-processing, and for good reason: adjacent elements inevitably report slightly different joint values because of discretisation, so an unaveraged plot looks patchy, and the average is generally closer to the exact solution than any individual element value. In the interior of a slab this is exactly what you want — all elements meeting at a node lie in the same plane and belong to the same structural member, so the average mixes like with like.
What happens at a slab–wall junction
At a supported edge the situation changes: the junction node belongs to two structural members at once. The slab shells connected to it report the slab hogging moment — in the example, about −1480.93 kg·m/m. The wall shells connected to the same node report the wall’s plate moments, which are quantities defined in the wall’s plane and in the wall’s own local axes. The contour must display one number per node, so it averages across all of these contributions. Two things follow:
- The magnitude of the slab support moment is diluted by the wall terms, so the contour shows a smaller number than the slab actually resists.
- The displayed value no longer corresponds to the internal force of any single member — it is a blend of slab bending and wall bending.
It is worth emphasising that this is purely a post-processing effect. The stiffness of the walls, the frame action between slab and wall, and the resulting distribution of forces are fully accounted for in the analysis. Only the on-screen averaged value mixes the two members.
Why a symmetric model can show an asymmetric contour
The same averaging also explains the loss of symmetry. The local axes of a wall are assigned by a fixed geometric convention, so the local axes of two opposite walls generally point the same way rather than mirroring each other. As a result, the wall moments folded into the nodal average enter with different signs at the two edges: one edge’s average is pushed further into hogging, the other is pulled towards zero. The underlying element results remain perfectly symmetric.
The example numbers can be reconstructed with a simple illustration. Assume the junction node connects two slab shells and two wall shells, and that the slab shells agree on a joint moment of −1480.93 kg·m/m:
|
At the junction node (kg·m/m) |
Left support |
Right support |
|
Joint moment M1 of the connected slab shells |
−1480.93 |
−1480.93 |
|
Contribution of the connected wall shells |
−223.83 |
+223.83 |
|
Contour value — average over all four shells |
≈ −852.38 |
≈ −628.55 |
|
Strip value — slab shells only |
−1480.93 |
−1480.93 |
Strip results: the values intended for design
When you cut a strip — or when ProtaStructure designs a slab or raft, which uses the same machinery — the averaged nodal database is not read at all. Instead the program:
- collects only the shell elements that belong to slab-type members in the cut plane (slabs, staircases, rafts and footing slabs);
- takes each element’s own joint results, in the slab’s local directions;
- re-averages them node by node among the slab shells only. Wall and column shells never enter this average.
The result is the bending moment carried by the slab itself at the support — the quantity needed to design the slab reinforcement. It is symmetric where the structure is symmetric, and it matches the contour everywhere except at the junction nodes, because in the slab interior both computations average the same set of elements.
Slab strip results and the slab design moments reported by ProtaStructure are consistent with each other, and both are the correct basis for reinforcement design. The contour value at a junction node is a visualisation value, not a design value.
Practical recommendations
- Read slab support design moments from slab strips, section cuts or the slab design results — not from the contour colours at slab–wall junction nodes.
- Use contours for what they are good at: the overall moment distribution, span values, gradients, and mesh sanity checks.
- Expect junction-node contour values to be smaller in magnitude than the strip support moments, and expect possible asymmetry at symmetric supports. Neither indicates an analysis error.
- The required steel area contours (As, Asd) are computed from the same averaged nodal moments, so the same caution applies to them at junction nodes.
- Away from supported edges, contour and strip values agree. A significant disagreement in the slab interior is worth investigating (mesh density, load application) — it is not the junction effect described here.
Frequently asked questions
Is my model or the analysis wrong when the contour is not symmetric?
No. The element-level results are symmetric, and equilibrium is satisfied. Only the averaged display values at the junction nodes differ, for the reasons explained under “Why a symmetric model can show an asymmetric contour”. You can confirm this by cutting a strip: it will report symmetric support moments.
Which value should I use for the support reinforcement?
The strip or design value, or its Wood–Armer design-moment variant where torsional moments are significant. This is also the value ProtaStructure uses internally when designing the slab.
Why do the contour and the strip agree at mid-span?
Because at interior nodes only slab shells are connected, both computations average the same set of elements and produce the same number.
Would a finer mesh remove the difference?
No. Refining the mesh narrows the affected band of the contour, but at the junction node itself the two averages are taken over different element populations by construction, so the difference remains. The two approaches converge only in the slab interior.
Does the same apply to shears and membrane forces?
Yes. Every nodally averaged effect (out-of-plane shears V13/V23, membrane forces F11/F22/F12) mixes wall contributions at junction nodes in the same way. Use strips or member results wherever a design.
Thank You
Thank you for choosing the ProtaStructure Suite product family.
It is our top priority to make your experience excellent with our software technology solutions.
Should you have any technical support requests or questions, please do not hesitate to contact us at all times through globalsupport@protasoftware.com and asiasupport@protasoftware.com
Our dedicated online support center together with our responsive technical support team is available to help you get the most out of Prota’s technology solutions.
The Prota Team